Microsoft Graph is a simple graphing program provided with Word. It includes the ability to view your graph data in both spreadsheet and graph formats. If the data you are presenting in Microsoft Graph is complex, particularly if you have many data series (rows of data to chart), you may want to add a legend. Legends provide a "road map" for your chart so a reader can decipher what is included.
You can display a legend with your chart by following these steps:
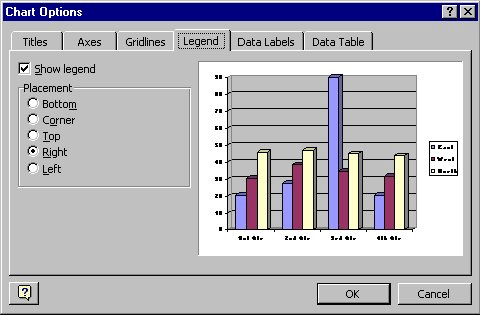
Figure 1. The Legend tab of the Chart Options dialog box
If you later want to turn off display of the legend, you can repeat the above steps, but clear the Show Legend check box, instead (step 3).
Once the legend is displayed in your chart, you can use your mouse to position it. Simply point to the legend with the mouse, hold down the mouse button, and drag the legend to where you finally want it. When you release the mouse button, Microsoft Graph places the legend in the spot where you dragged it.
WordTips is your source for cost-effective Microsoft Word training. (Microsoft Word is the most popular word processing software in the world.) This tip (721) applies to Microsoft Word 97, 2000, 2002, and 2003.
The First and Last Word on Word! Bestselling For Dummies author Dan Gookin puts his usual fun and friendly candor back to work to show you how to navigate Word 2019. Spend more time working and less time trying to figure it all out! Check out Word 2019 For Dummies today!
Microsoft Graph allows you to display both your chart and data, if desired. All it takes is to make a simple change to a ...
Discover MoreMicrosoft Graph is a handy way to add charts to your document if you don't have access to Excel. Here's how to adjust the ...
Discover MoreMicrosoft Graph allows you to easily create charts from numeric data, without the need to use Excel. This tip explains ...
Discover MoreFREE SERVICE: Get tips like this every week in WordTips, a free productivity newsletter. Enter your address and click "Subscribe."
There are currently no comments for this tip. (Be the first to leave your comment—just use the simple form above!)
Got a version of Word that uses the menu interface (Word 97, Word 2000, Word 2002, or Word 2003)? This site is for you! If you use a later version of Word, visit our WordTips site focusing on the ribbon interface.
Visit the WordTips channel on YouTube

FREE SERVICE: Get tips like this every week in WordTips, a free productivity newsletter. Enter your address and click "Subscribe."
Copyright © 2026 Sharon Parq Associates, Inc.
Comments