Each graph you create includes axes. Depending on your graph type, it can have 0, 2, or 3 axes. Each axis has a scale, which determines how the information along that axis is graphed. By default, Microsoft Graph determines this scale automatically based on the data you are graphing. You can, however, override the default and specify a scale. What you see when you do this depends on which axis you are scaling. For instance, if you are scaling the X axis, you can specify how the data categories graphed along the axis relate to the Y axis. These steps allow you to scale the X axis:
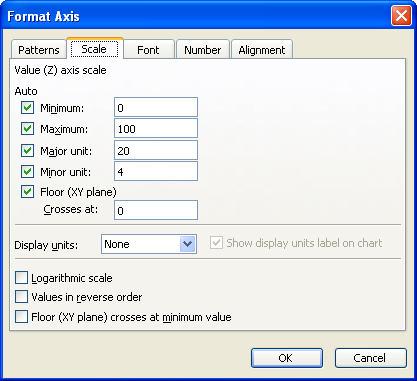
Figure 1. The Scale tab of the Format Axis dialog box
WordTips is your source for cost-effective Microsoft Word training. (Microsoft Word is the most popular word processing software in the world.) This tip (710) applies to Microsoft Word 97, 2000, 2002, and 2003.

Do More in Less Time! An easy-to-understand guide to the more advanced features available in the Microsoft 365 version of Word. Enhance the quality of your documents and boost productivity in any field with this in-depth resource. Complete your Word-related tasks more efficiently as you unlock lesser-known tools and learn to quickly access the features you need. Check out Microsoft 365 Word For Professionals For Dummies today!
Microsoft Chart offers several different types of charts you can use to display your data. Here's how to pick the type ...
Discover MoreMicrosoft Graph allows you to easily create charts from numeric data, without the need to use Excel. This tip explains ...
Discover MoreGridlines are often added to charts to help improve the readability of the data presented in the chart. Here's how you ...
Discover MoreFREE SERVICE: Get tips like this every week in WordTips, a free productivity newsletter. Enter your address and click "Subscribe."
2018-12-19 06:09:11
Steve
For majority of graphs that do not aplay to linear scale and have zero included (log scale can not use 0, other settings are not possible within Excel). Graphing in Excel is useless ! And that aplays to almost all science, math and others use of for that purpose ! So why enforcing Office and Excel when knowing that ?
Got a version of Word that uses the menu interface (Word 97, Word 2000, Word 2002, or Word 2003)? This site is for you! If you use a later version of Word, visit our WordTips site focusing on the ribbon interface.
Visit the WordTips channel on YouTube

FREE SERVICE: Get tips like this every week in WordTips, a free productivity newsletter. Enter your address and click "Subscribe."
Copyright © 2026 Sharon Parq Associates, Inc.
Comments