The graphs created by Microsoft Graph are based on data contained in a simple spreadsheet called a datasheet. Microsoft Graph displays this data in row-and-column format. You can format the numbers in a datasheet in much the same way as you would in a spreadsheet, like Excel. To format numbers, follow these steps:
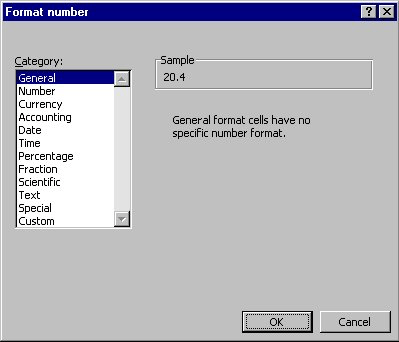
Figure 1. The Format Number dialog box
WordTips is your source for cost-effective Microsoft Word training. (Microsoft Word is the most popular word processing software in the world.) This tip (708) applies to Microsoft Word 97, 2000, 2002, and 2003.

Do More in Less Time! An easy-to-understand guide to the more advanced features available in the Microsoft 365 version of Word. Enhance the quality of your documents and boost productivity in any field with this in-depth resource. Complete your Word-related tasks more efficiently as you unlock lesser-known tools and learn to quickly access the features you need. Check out Microsoft 365 Word For Professionals For Dummies today!
A legend can help explain the various lines or objects visible in a chart. Microsoft Chart allows you to turn on or off ...
Discover MoreMicrosoft Graph is a great way to add simple charts to your documents. Once you've got a graph added, you might want to ...
Discover MoreMicrosoft Graph allows you to display both your chart and data, if desired. All it takes is to make a simple change to a ...
Discover MoreFREE SERVICE: Get tips like this every week in WordTips, a free productivity newsletter. Enter your address and click "Subscribe."
There are currently no comments for this tip. (Be the first to leave your comment—just use the simple form above!)
Got a version of Word that uses the menu interface (Word 97, Word 2000, Word 2002, or Word 2003)? This site is for you! If you use a later version of Word, visit our WordTips site focusing on the ribbon interface.
Visit the WordTips channel on YouTube

FREE SERVICE: Get tips like this every week in WordTips, a free productivity newsletter. Enter your address and click "Subscribe."
Copyright © 2026 Sharon Parq Associates, Inc.
Comments